
The A1C to eAG conversion calculator converts a hemoglobin A1C percentage into an estimated average glucose (eAG) value in mg/dL, mmol/L, or IFCC mmol/mol, and converts an average glucose value back into an A1C percentage. A1C represents the percentage of hemoglobin in red blood cells that carries attached glucose. This page explains how laboratories calculate the A1C percentage, applies the ADA formula for A1C to eAG and eAG to A1C conversion, and reports results in 3 unit systems. It classifies results against normal, prediabetes, and diabetes ranges, states the ADA target for people managing diabetes, and explains why eAG differs from a glucose meter or CGM average. It lists 6 medical conditions that reduce A1C accuracy and names 4 alternative tests for those cases.
How Is A1C Measured and What Does the Percentage Represent?
A1C represents the percentage of hemoglobin in red blood cells that has glucose attached to it. Laboratories measure total glycated hemoglobin and total hemoglobin in a blood sample, divide the first number by the second, and multiply the result by 100 to produce the A1C percentage. Red blood cells live 120 days on average, so the A1C percentage reflects average blood glucose over the prior 2 to 3 months, not blood glucose on any single day. According to Harvard Medical School research on hemoglobin glycation, glucose molecules attach to hemoglobin at a rate proportional to blood glucose concentration, so a higher blood glucose average produces a higher percentage of glycated hemoglobin.
How Do You Convert A1C to eAG Using the ADA Formula?
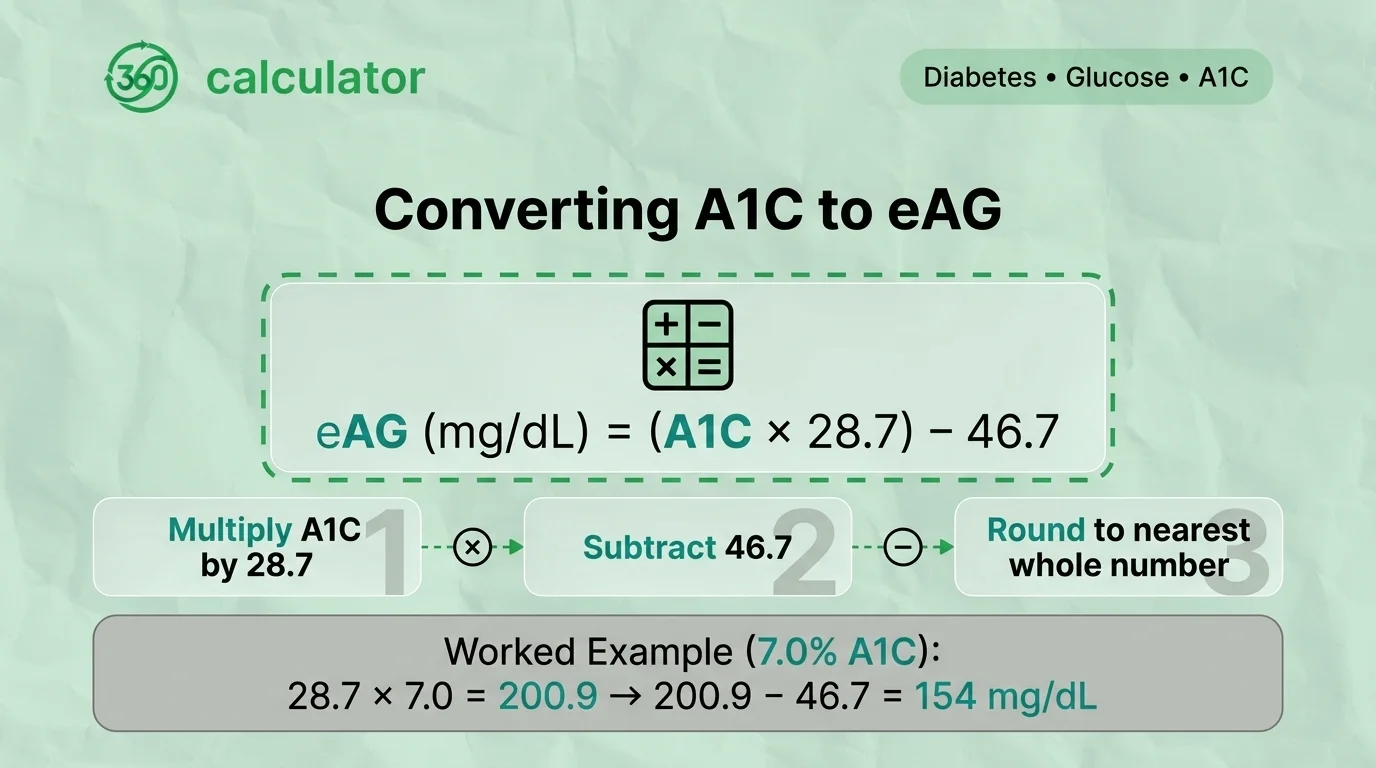
To convert A1C to eAG in mg/dL, multiply the A1C percentage by 28.7 and subtract 46.7. The American Diabetes Association Derived Average Glucose (ADAG) Study Group developed this formula from continuous glucose monitor data collected across 3 months for each study participant. An A1C of 7.0% produces an eAG of 154 mg/dL: 28.7 x 7.0 - 46.7 = 154. An A1C of 6.5% produces an eAG of 140 mg/dL. The eAG value estimates a population average glucose relationship, not a direct measurement of one person's blood glucose.
Follow these 3 steps to calculate eAG in mg/dL from an A1C percentage:
1. Multiply the A1C percentage by 28.7.
2. Subtract 46.7 from the result.
3. Round the answer to the nearest whole number for mg/dL.
This calculation applies to any A1C value between 4% and 15%.
How Do You Convert A1C to eAG in mmol/L Instead of mg/dL?
To convert eAG from mg/dL to mmol/L, divide the mg/dL value by 18. The United States reports blood glucose in mg/dL, while the United Kingdom, Canada, and Australia report blood glucose in mmol/L. An eAG of 154 mg/dL equals 8.6 mmol/L: 154 / 18 = 8.6. Some calculators use 18.015 or 18.016 as the divisor, which changes the result by less than 0.01 mmol/L and does not change the clinical meaning of the value.
The table below lists 5 A1C percentages with the matching eAG value in mg/dL and mmol/L.
A1C (%) | eAG (mg/dL) | eAG (mmol/L) |
6.0 | 126 | 7.0 |
6.5 | 140 | 7.8 |
7.0 | 154 | 8.6 |
7.5 | 169 | 9.4 |
8.0 | 183 | 10.2 |
What Is the IFCC mmol/mol Value and How Does It Relate to A1C and eAG?
The IFCC mmol/mol value reports the same blood test as the A1C percentage, on a different numeric scale. To calculate A1C in mmol/mol, subtract 2.15 from the A1C percentage and multiply the result by 10.929. An A1C of 6.5% equals 48 mmol/mol: 10.929 x (6.5 - 2.15) = 47.5, rounded to 48. According to the International Federation of Clinical Chemistry, this unit measures identical hemoglobin glycation to the US A1C percentage and the eAG value, and applies in the United Kingdom, Australia, and parts of Europe.
The table below lists 5 A1C percentages with the matching eAG value in mg/dL, eAG value in mmol/L, and IFCC value in mmol/mol.

A1C (%) | eAG (mg/dL) | eAG (mmol/L) | IFCC (mmol/mol) |
6.0 | 126 | 7.0 | 42 |
6.5 | 140 | 7.8 | 48 |
7.0 | 154 | 8.6 | 53 |
7.5 | 169 | 9.4 | 58 |
8.0 | 183 | 10.2 | 64 |
How Do You Convert eAG or Average Glucose Back to A1C?
To convert eAG to A1C, add 46.7 to the eAG value in mg/dL and divide the result by 28.7. An average glucose of 200 mg/dL produces an estimated A1C of 8.6%: (200 + 46.7) / 28.7 = 8.6. An average glucose of 100 mg/dL produces an estimated A1C of 5.1%: (100 + 46.7) / 28.7 = 5.1. A single month of glucose readings produces a less reliable estimate than a full 3-month average, because A1C reflects red blood cell turnover across 3 months, not recent readings alone.
3 factors reduce the accuracy of a reverse-calculated A1C estimate:
• A data collection window under 4 weeks.
• Self-monitored readings clustered around fasting and pre-meal times.
• Missing readings from post-meal glucose peaks.
A continuous glucose monitor average taken over 3 months produces the most accurate reverse-calculated A1C estimate.
What Do Your A1C and eAG Results Mean Compared to Normal, Prediabetes, and Diabetes Ranges?

An A1C result falls into the normal range below 5.7%, the prediabetes range from 5.7% to 6.4%, or the diabetes range at 6.5% or above. According to the Centers for Disease Control and Prevention, these 3 categories use the same A1C thresholds for every adult regardless of age, sex, or ethnicity. A diabetes diagnosis requires 2 separate A1C results of 6.5% or higher, or 1 A1C result plus a confirming glucose test.
The table below lists the eAG range in mg/dL and mmol/L for each of the 3 A1C diagnostic categories.
Category | A1C Range | eAG Range (mg/dL) | eAG Range (mmol/L) |
Normal | Below 5.7% | Below 117 | Below 6.5 |
Prediabetes | 5.7% to 6.4% | 117 to 137 | 6.5 to 7.6 |
Diabetes | 6.5% or above | 140 or above | 7.8 or above |
What A1C or eAG Target Does the ADA Recommend for People Managing Diabetes?
The ADA recommends an A1C target below 7.0%, equal to an eAG below 154 mg/dL, for most adults with diagnosed diabetes. Individual targets range from below 6.5% for adults who reach tighter control without hypoglycemia, up to 7.5% to 8.0% for older adults or adults with multiple chronic conditions and a higher hypoglycemia risk. A physician sets the final personalized target based on age, diabetes duration, and hypoglycemia history.
The table below lists the ADA target range for 3 patient groups.
Patient Group | A1C Target | eAG Target (mg/dL) |
Most non-pregnant adults with diabetes | Below 7.0% | Below 154 |
Adults with low hypoglycemia risk | Below 6.5% | Below 140 |
Older adults or multiple chronic conditions | 7.5% to 8.0% | 169 to 183 |
Why Doesn't Your eAG Match the Average on Your Glucose Meter or CGM?
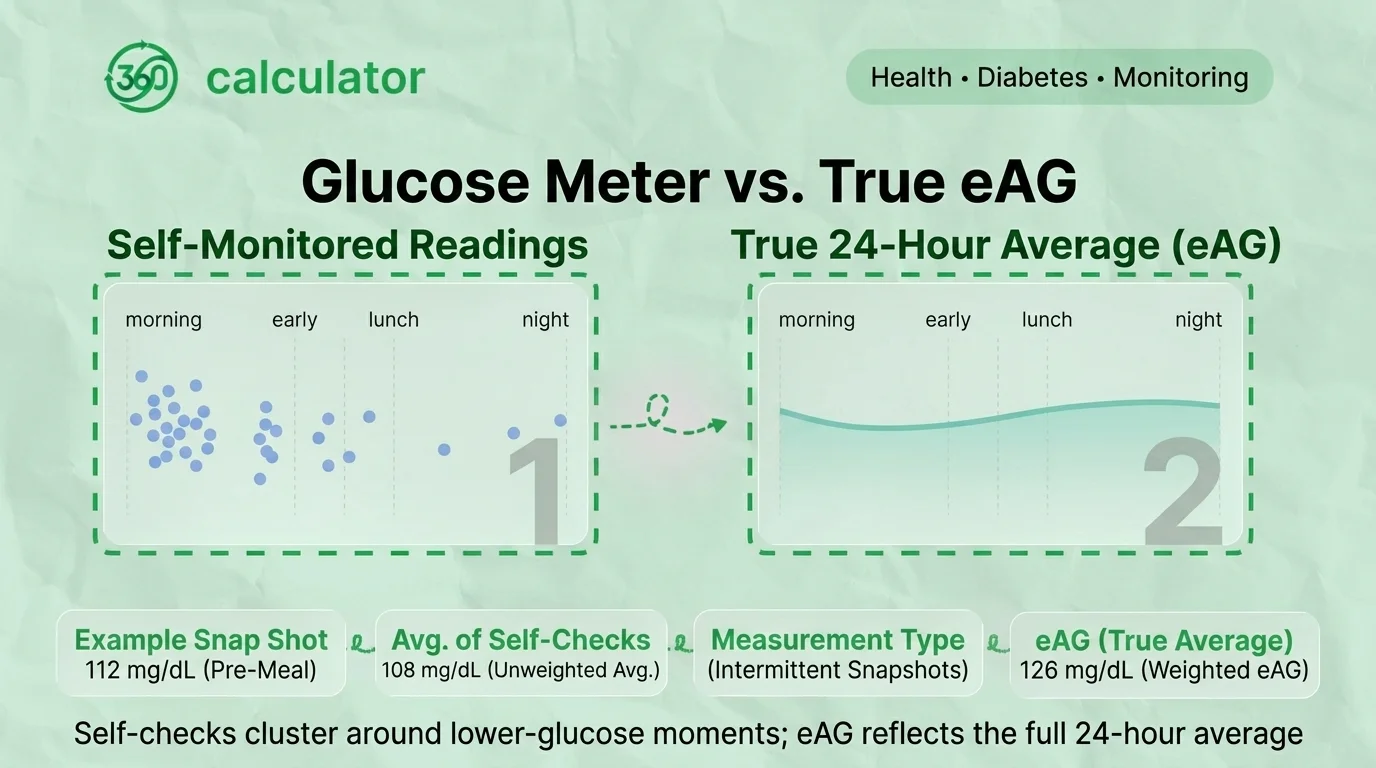
eAG differs from a meter or CGM average because eAG represents a 24-hour glucose average across 3 months, while a meter average reflects only the specific moments a person chose to test. People test blood glucose more often before meals and in the morning, when glucose runs lower, so a meter average skews below the true 24-hour average. eAG and self-monitored glucose serve 2 different purposes: self-checks show how a specific meal, activity, or medication dose affects glucose at that moment, while eAG and A1C show the average trend across months. Neither value replaces the other.
What Medical Conditions Can Make A1C or eAG Results Inaccurate?
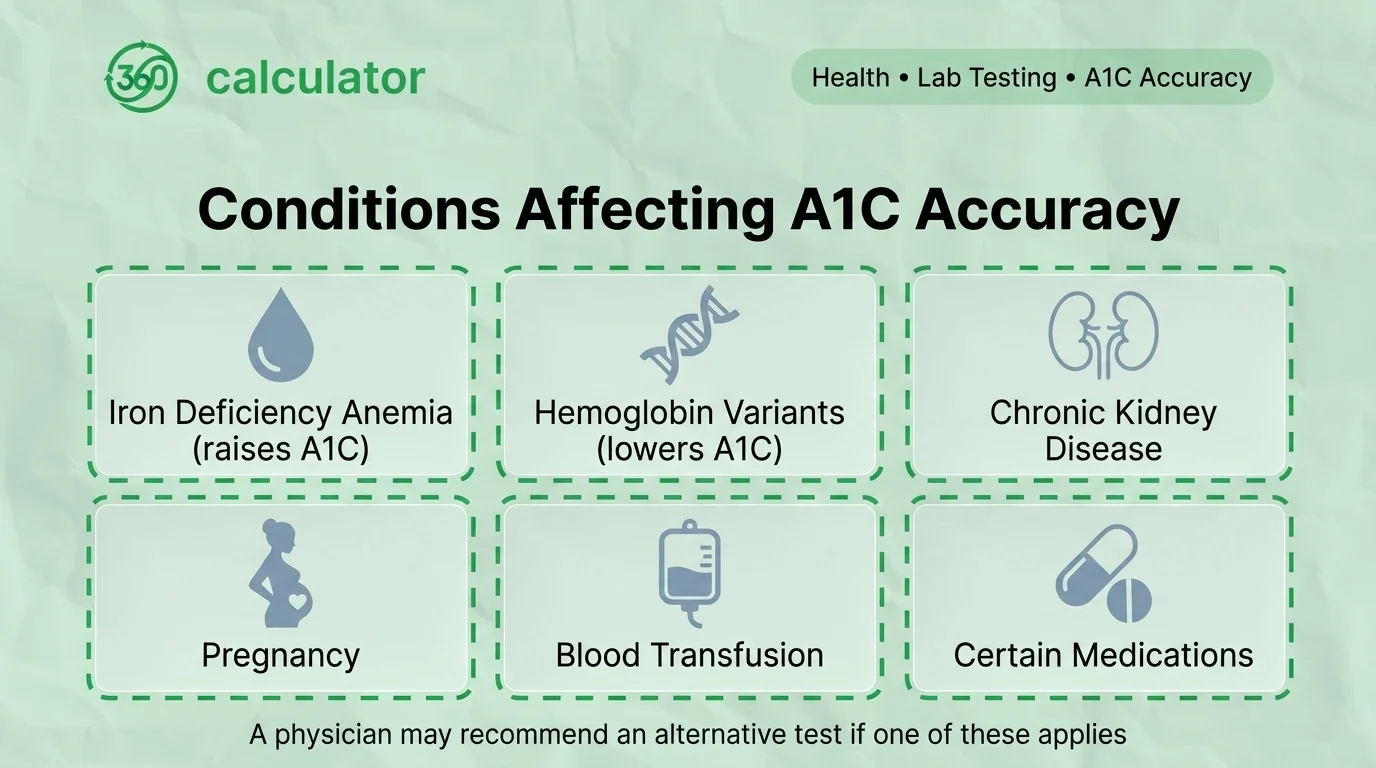
6 conditions reduce the accuracy of A1C and eAG results: anemia, hemoglobin variants, chronic kidney disease, pregnancy, recent blood transfusion, and certain medications. Each condition changes red blood cell lifespan or hemoglobin structure, which shifts the relationship between actual blood glucose and the A1C percentage.
• Iron deficiency anemia extends red blood cell lifespan and raises the A1C percentage above the true glucose average.
• Hemoglobin variants, including sickle cell trait and thalassemia, shorten red blood cell lifespan and lower the A1C percentage below the true glucose average.
• Chronic kidney disease shortens red blood cell lifespan through increased red blood cell turnover.
• Pregnancy shortens red blood cell lifespan during the second and third trimesters.
• A recent blood transfusion introduces donor red blood cells with a different glycation history.
• Certain medications, including dapsone and high-dose vitamin C, interfere with the laboratory test used to measure A1C.
A person with any of these 6 conditions requires a different monitoring method than A1C alone.
What Alternative Tests Can Be Used When A1C or eAG Is Not Reliable?
4 alternative tests estimate average glucose when A1C is not reliable: the Glucose Management Indicator, fructosamine, glycated albumin, and 1,5-anhydroglucitol.
• The Glucose Management Indicator calculates an A1C-equivalent percentage from 10 to 14 days of continuous glucose monitor data.
• Fructosamine reflects average glucose over the prior 2 to 3 weeks.
• Glycated albumin reflects average glucose over the prior 2 to 3 weeks, similar to fructosamine.
• 1,5-anhydroglucitol reflects short-term glucose spikes over the prior 1 to 2 weeks.
A physician selects among these 4 alternatives based on the specific condition affecting A1C accuracy.
Related Topics for Understanding and Managing Your A1C and Blood Sugar Results
A single A1C to eAG conversion answers one question, but 4 related questions come up after a conversion: how the value compares across a full range of A1C percentages, what a normal range looks like for a specific age group, how to lower a high A1C number, and how the value compares with other blood sugar measurements. The next 6 sections address these related questions.
What Does a Full A1C to eAG Chart Look Like Across All Values?
A full A1C to eAG lookup table contains 21 rows of A1C percentages in 0.5% increments, each with a matching eAG value in mg/dL, mmol/L, and IFCC mmol/mol, available in the A1C to eAG Chart for readers who look up multiple values instead of converting one number.
What Is a Normal A1C Range Based on Your Age and Health Status?
Target ranges shift for adults over 65 and for pregnant women, though the diagnostic thresholds for normal, prediabetes, and diabetes stay the same for every adult, as detailed in the Normal A1C Range by Age guide.
How Can You Lower a High A1C Through Diet, Exercise, and Lifestyle Changes?
Losing 5% to 7% of body weight through diet and exercise changes lowers A1C by 0.5 to 2.0 percentage points over 3 to 6 months, a strategy covered in How to Lower Your A1C.
How Does eAG Compare With Time in Range (TIR) From a CGM?
A Time in Range value above 70% corresponds to an A1C near 7%, measuring the percentage of a 24-hour period that glucose stays between 70 mg/dL and 180 mg/dL, as explained in the Time in Range guide.
How Do You Convert Blood Sugar Between mg/dL and mmol/L for Everyday Readings?
The same division by 18 converts a single glucose meter reading from mg/dL to mmol/L, rather than an A1C-derived eAG value, a conversion available in the mg/dL to mmol/L Calculator.
What Are Normal Fasting and After-Meal Blood Sugar Ranges Compared to A1C?
A normal fasting glucose range and a normal post-meal range under 140 mg/dL at 2 hours after eating complement the multi-month average shown by A1C and eAG, both listed in the Blood Sugar Chart.
Frequently Asked Questions
Does eAG replace the A1C test?
No. eAG is a calculated conversion of the same A1C blood test, reported in mg/dL, mmol/L, or mmol/mol instead of a percentage.
Can 2 different laboratories report different A1C results from the same blood sample?
Yes. Results vary by up to 0.5 percentage points across laboratories due to instrument calibration differences.
Does a single day of exercise change eAG?
No. eAG reflects a 3-month average, so one day of exercise, one meal, or one illness does not change the eAG value.
Is an A1C of 5.7% a permanent result?
No. Diet, exercise, and weight loss changes lower an A1C of 5.7% back into the normal range within 3 to 6 months for many adults.
Does the ADA formula apply to children with diabetes?
Yes. The ADAG Study Group formula applies to A1C values for both adults and children, though target A1C ranges differ by age.