

This calculator works out the average of any set of numbers the moment you type them in. Average is just another name for the mean, and finding it comes down to one simple idea: add up the numbers, then divide by how many there are. For example, if you enter 12, 15, 18, and 21, the tool returns 16.5 straight away, with no manual addition or division needed.
What Is an Average and How Is It Calculated?
An average is the sum of a group of numbers divided by how many numbers are in that group. This is exactly what mathematicians and teachers mean when they say "arithmetic mean"; the two terms describe the same calculation and are used interchangeably in everyday situations. Say you have five numbers: 10, 20, 15, 25, and 30. Add them together and you get 100. Divide 100 by 5, the count of numbers, and the average comes out to 20. That single formula, sum divided by count, is the foundation for everything else this page covers.
What Is the Average Formula?
In plain words, the average formula is the sum of all observations divided by the total number of observations. An observation is simply one number you enter, and the count is how many numbers you entered in total. Picture a student with test scores of 78, 85, and 91. Adding those three scores gives 254, and dividing by 3, since there are three observations, gives an average score of about 84.67.
How Do You Calculate an Average Step by Step?
1. List out every number in your data set.
2. Add all of those numbers together to get a total.
3. Count how many numbers you listed.
4. Divide the total from step 2 by the count from step 3.
Take five daily temperature readings: 70, 72, 68, 75, and 74 degrees. Adding them gives 359, and there are five readings, so 359 divided by 5 gives an average temperature of 71.8 degrees. The calculator on this page runs through these same four steps automatically the instant you enter your numbers.
What Do Sum and Count Mean in an Average Calculation?
Sum is simply the total you get once every number in your data set has been added together, and count is how many individual values make up that data set. Both figures appear as separate results next to the average on this page, since many users want to check the total or the number of entries on their own, not just the final average. For a data set of 8, 12, 9, and 15, the sum is 44 and the count is 4, which is why dividing 44 by 4 gives an average of 11.
Data Set | Sum | Count | Average |
8, 12, 9, 15 | 44 | 4 | 11 |
How Does This Average Calculator Work?
Using the tool is straightforward. Type or paste your numbers into the input box, separating them with commas, spaces, or line breaks, whichever feels natural. As soon as you enter a value, the result updates on its own. There is nothing to install and no account to create, and the calculator accepts positive numbers, negative numbers, and decimals without any extra setup.
What Numbers Can You Enter Into the Calculator?
The tool accepts whole numbers, decimals, and negative values, and you can separate them with commas, spaces, or new lines, whatever matches how your data is already formatted. If you have a column of figures copied from a spreadsheet, such as survey responses or a list of expenses, you can paste that column directly into the box, and it will be read correctly. If a non-numeric character slips into the input, the calculator flags it instead of quietly producing a wrong result, so you always know your entry needs a second look.
Input Style | Example |
Comma-separated | 12, 18, 25, 30 |
Space-separated | 12 18 25 30 |
One number per line | 12 / 18 / 25 / 30, each on its own line |
Pasted from a spreadsheet column | Column of 12, 18, 25, 30 copied and pasted as is |
What Results Does the Calculator Show Besides the Average?
● Sum, the total of every number added together.
● Count how many numbers were entered.
● Median, the middle value once the numbers are sorted.
● Minimum, the smallest number in the data set.
● Maximum, the largest number in the data set.
●4, 8, Range, the gap between the maximum and the minimum.
These extra figures are useful for anyone who wants to double-check a data set for typos or unusual outliers before trusting the average.
Result | Value for 8, 12, 9, 15, 30 |
Average | 14.8 |
Sum | 74 |
Count | 5 |
Median | 12 |
Minimum | 8 |
Maximum | 30 |
Range | 22 |
Why Does the Calculator Update Instantly?
The result recalculates the moment a number is added, changed, or removed, so there is no separate button to press. This makes it easy to test different scenarios quickly, such as removing one low score to see how much it changes a class average.
What Is the Difference Between Average, Mean, Median, and Mode?
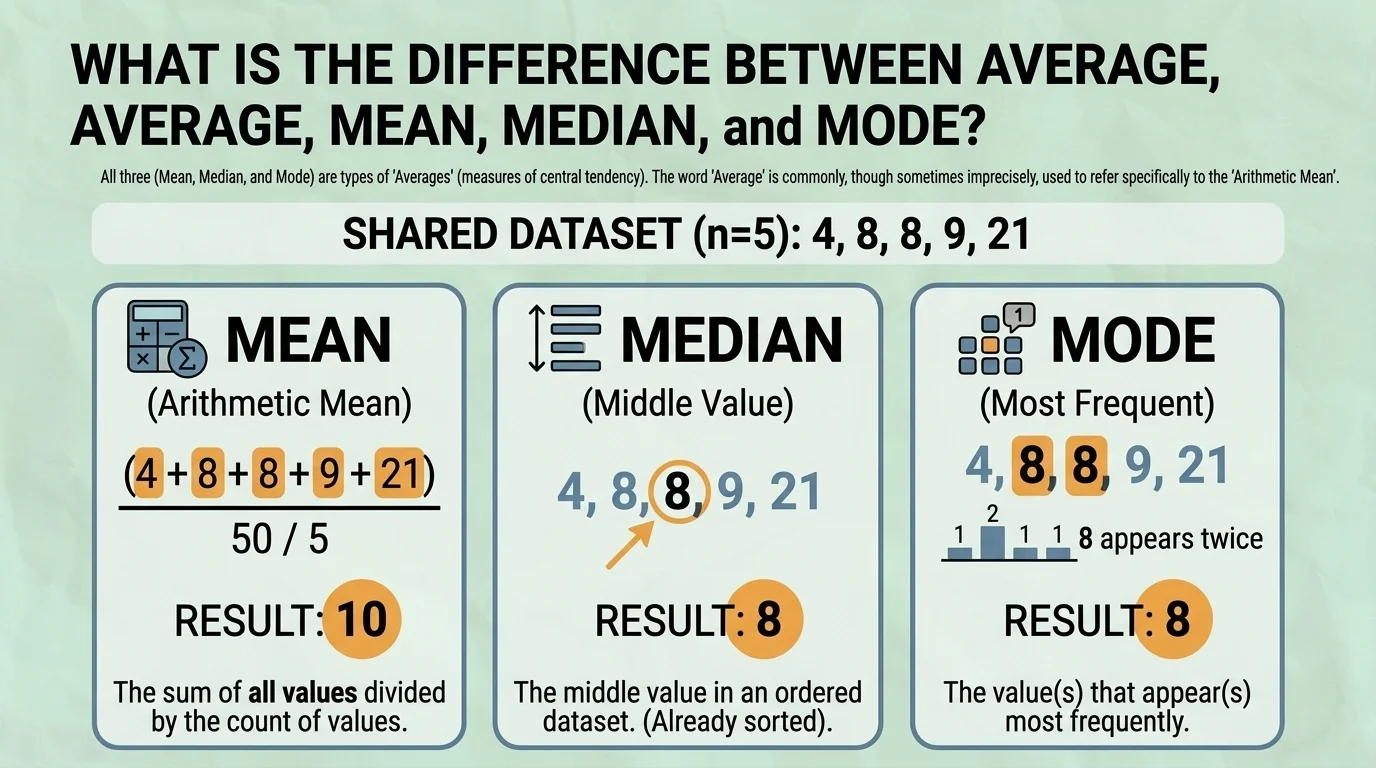
In most everyday situations, average and mean describe the exact same calculation, sum divided by count. Median and mode are different ways of describing the center of a data set. Median is the middle value once the numbers are arranged in order, and mode is the value that shows up most often. Using the same set of numbers for all three, 4, 8, 8, 9, and 21, makes the difference easy to see side by side.
Measure | How It's Found | Result for 4, 8, 8, 9, 21 |
Mean (Average) | Sum divided by count | 10 |
Median | Middle value after sorting | 8 |
Mode | Value that appears most often | 8 |
When Should You Use the Median Instead of the Average?
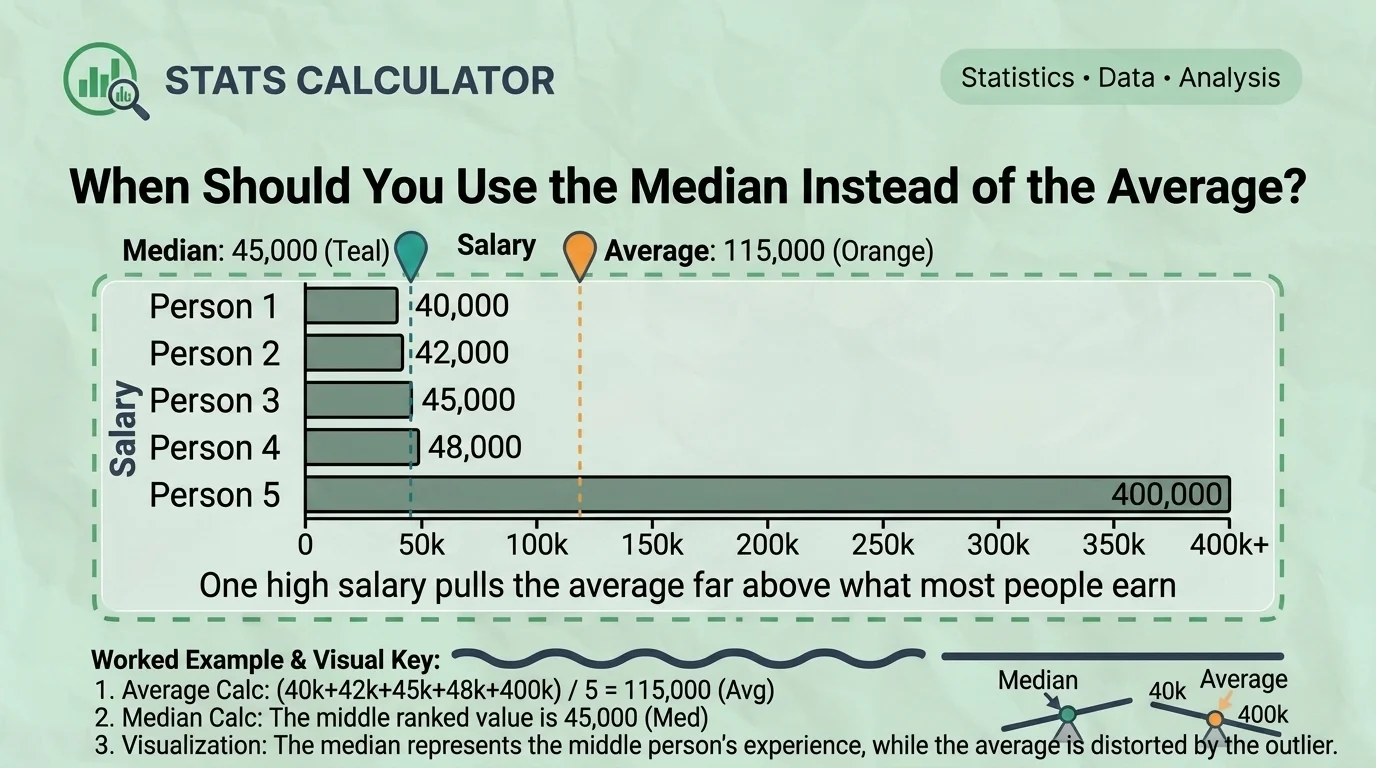
The median becomes the more honest number when a data set contains a few extreme values, such as salaries or home prices. Picture a small company where five employees earn 40,000, 42,000, 45,000, and 48,000 and one owner earns 400,000. The average salary comes out well over 100,000, which does not reflect what almost anyone at the company actually earns, while the median stays close to 45,000, right where most of the salaries sit. This is a well-known issue in statistics, and income figures are a textbook example of where the mean can mislead.
Salaries | Average | Median |
40,000 / 42,000 / 45,000 / 48,000 / 400,000 | 115,000 | 45,000 |
Why Do Outliers Change the Average but Not the Median?
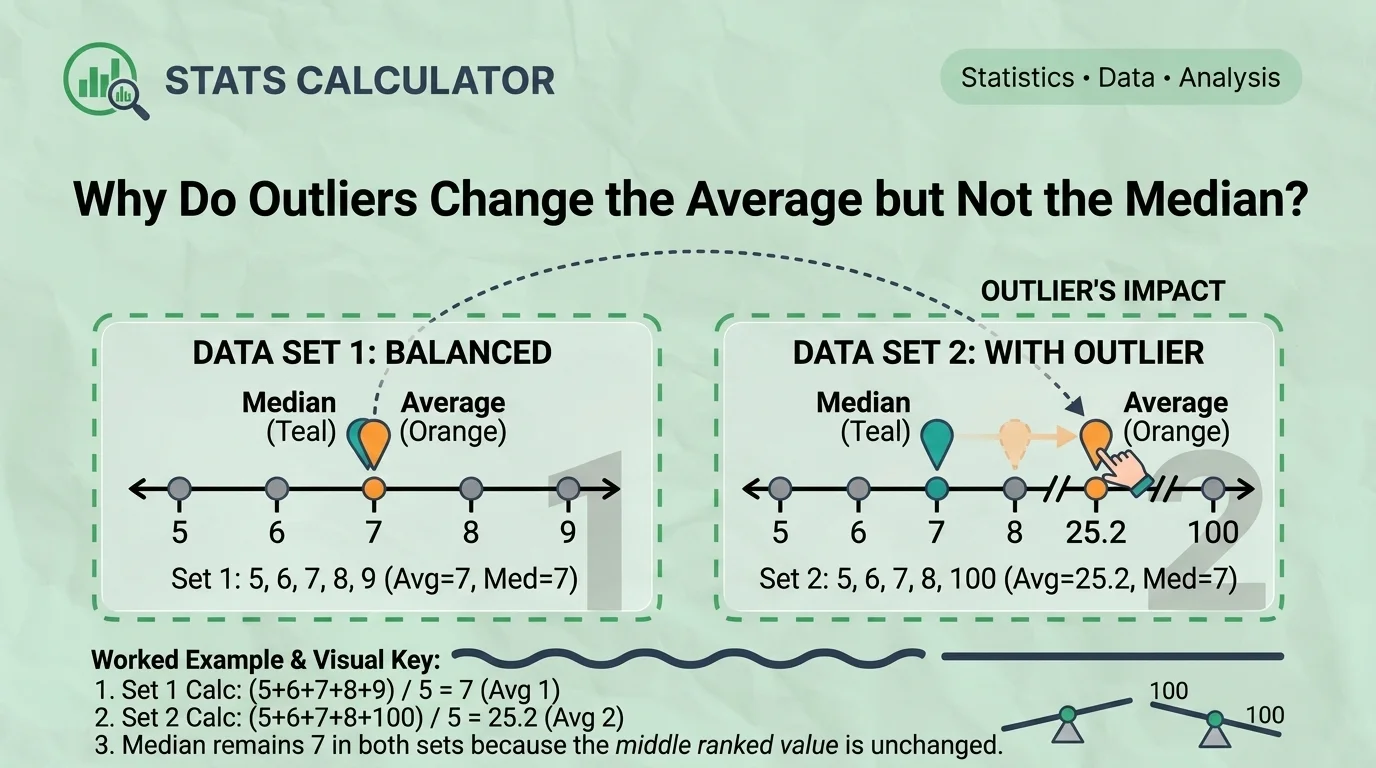
Every value in a data set pulls on the average, since all the numbers are added together before dividing, while the median only cares about which value happens to sit in the middle. Take the data sets 5, 6, 7, 8, and 9, which have an average of 7. Replace the 9 with 100 and the average jumps to 25.2, a huge shift caused by one number. The median, however, barely moves, since 7 still sits in the middle either way.
Data Set | Average | Median |
5, 6, 7, 8, 9 | 7 | 7 |
5, 6, 7, 8, 100 | 25.2 | 7 |
What Are Common Mistakes People Make When Calculating an Average?
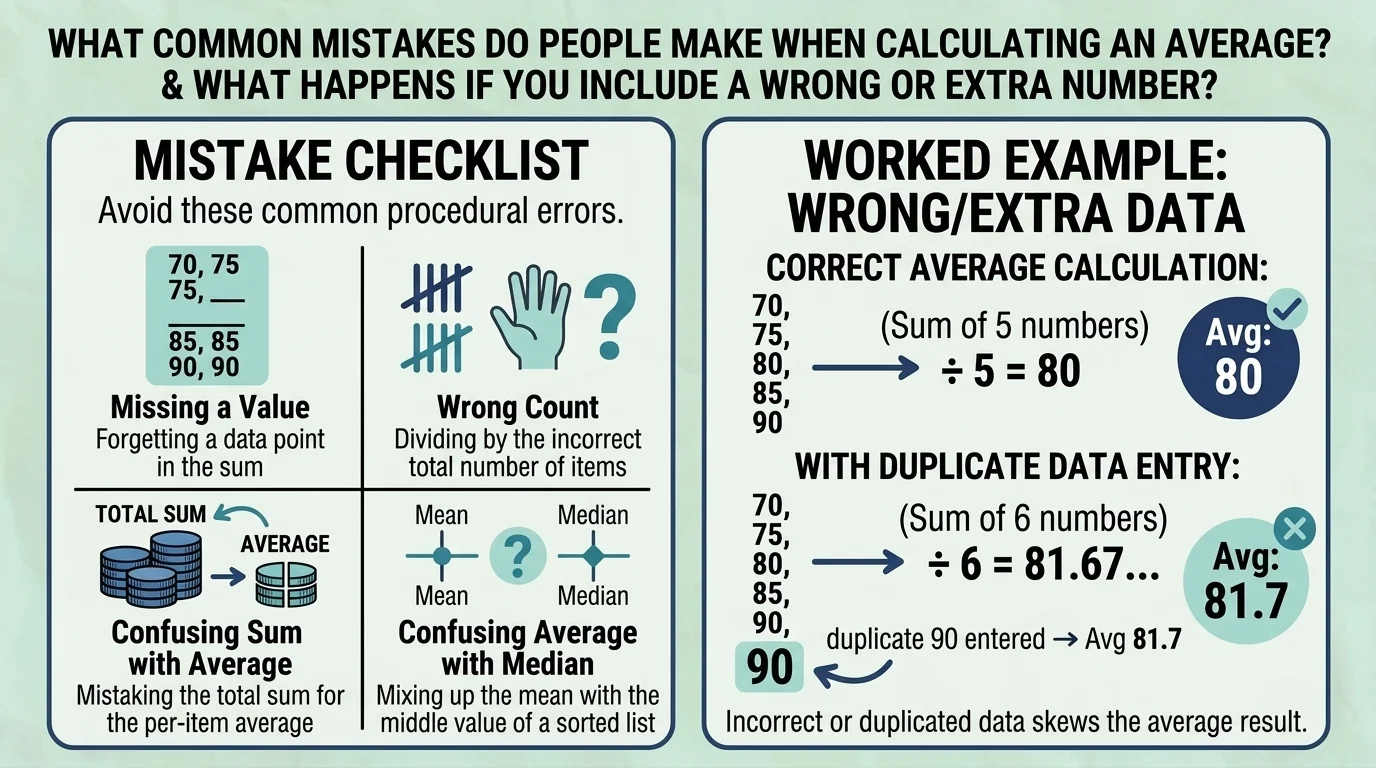
● Forgetting to include every value in the data set, which lowers or inflates the total unfairly.
● Counting the wrong number of entries, which throws off the division step even if the sum is correct.
● Mixing up sum and average and reporting the total as if it were the final result.
● Confusing average with median, especially when a data set has a few unusually high or low numbers.
This calculator avoids every one of these errors automatically, since it counts and sums every entered value with no manual steps for you to miscalculate.
What Happens If You Include a Wrong or Extra Number?
A single incorrect or duplicate entry shifts both the sum and the count, which moves the average away from its true value. Take five exam scores of 70, 75, 80, 85, and 90, which average out to 80. If the 90 is accidentally entered twice, the average rises to about 81.7, even though nothing about the real data changed. It is worth double-checking entered numbers against the original source, such as a gradebook or a receipt, before relying on the result.
Entry | Numbers | Average |
Correct | 70, 75, 80, 85, 90 | 80 |
90 entered twice by mistake | 70, 75, 80, 85, 90, 90 | 81.7 |
Can an Average Be Negative or a Decimal?
An average is a decimal far more often than not, since a sum rarely divides evenly by its count. Three test scores of 80, 85, and 88 average out to 84.33, for instance. An average can also turn out negative if the data set includes negative numbers, such as temperature readings below zero or account balances that are overdrawn. Neither result means a mistake was made; both are simply what the math produces.
Example | Numbers | Average |
Decimal result | 80, 85, 88 | 84.33 |
Negative result | -4, -8, 2, -6 | -4 |
Where Do People Use Average Calculations in Real Life?
Averages show up far beyond the classroom. Students use them to check their grades, shoppers use them to track monthly spending, investors use them to follow share price movement, athletes use them to review performance stats, and teams use them to monitor recurring business metrics. Some of these situations call for a more specific type of average than the simple calculation covered above, and each one has its own dedicated tool.
How Do You Calculate a Weighted Average?
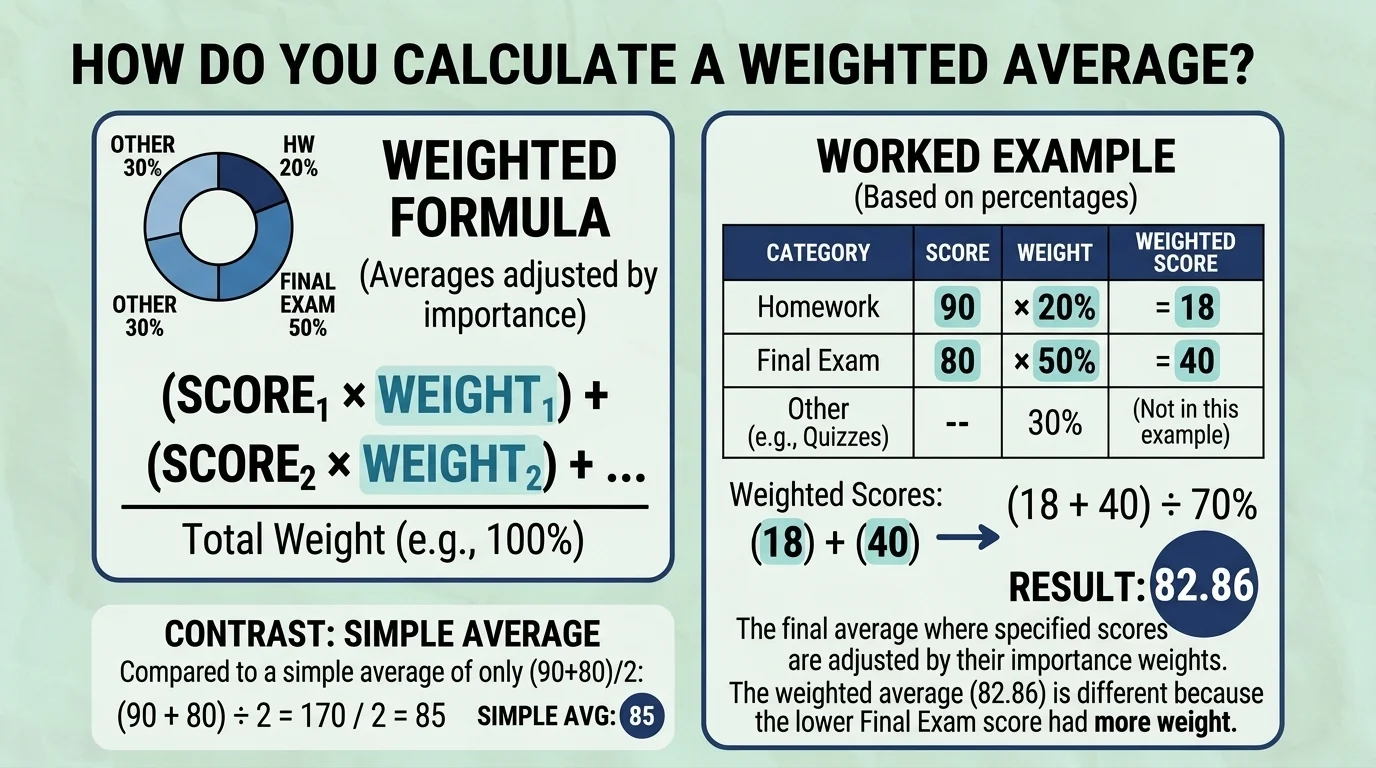
A weighted average multiplies each value by its own weight before adding the results together and dividing by the total of the weights, unlike a simple average where every value counts equally. Picture a course where homework is worth 20 percent of the grade and the final exam is worth 50 percent; two data sets with identical raw scores can end up with different final grades once those weights are applied. If you need to work out a result like this for your own numbers, the weighted average calculator handles the weighting for you.
Component | Score | Weight | Weighted Value |
Homework | 90 | 20% | 18 |
Final Exam | 80 | 50% | 40 |
How Do You Calculate Your Grade or GPA Average?
A class or semester grade is usually a weighted average of assignments, tests, and exams, since each of those typically contributes a different percentage toward the final mark. Some schools instead treat every assignment equally and use a simple average, so it is worth checking your syllabus before assuming which method applies. Two assignments worth 30 percent and 70 percent, for example, will produce a different course grade than a simple average of the same two scores. For entering your own assignments and weights, use the grade calculator or the GPA calculator.
Assignment | Score | Weight |
Assignment 1 | 85 | 30% |
Assignment 2 | 92 | 70% |
How Do You Calculate a Stock Average Price?
An average share price is worked out by multiplying each purchase price by the number of shares bought at that price, adding those totals together, and dividing by the total number of shares owned, which makes it a weighted average in practice. Two purchases, say 10 shares at 50 and 20 shares at 60, produce a different average price than simply averaging 50 and 60 together. This figure only reflects the trades you enter and does not track live market prices. For working this out with your own trade history, the stock average price calculator is built for exactly this.
Purchase | Shares | Price | Total |
Purchase 1 | 10 | 50 | 500 |
Purchase 2 | 20 | 60 | 1,200 |
How Do You Calculate a Moving Average?
A moving average recalculates using only the most recent set number of values, dropping the oldest entry each time a new one is added, which makes it different from a single average of a fixed data set. Over a week of daily numbers, a 3-day moving average shifts a little each day as older values roll off and newer ones come in. This is commonly used to smooth out daily sales fluctuations or to track a rolling trend over time. For a longer-running data set, the moving average calculator is the better tool for the job.
Day | Daily Value | 3 Day Moving Average |
Mon, Tue, Wed | 20, 24, 22 | 22 |
Tue, Wed, Thu | 24, 22, 28 | 24.7 |
How Do You Calculate a Percentage Average?
Averaging raw numbers is not the same as averaging percentages, and combining percentages from data sets of different sizes without weighting them can produce a misleading result. Two test results expressed as percentages, one out of 20 questions and one out of 50 questions, need to be weighted by the number of questions before they are averaged together, or the smaller test ends up counting just as much as the larger one. Convert raw scores into percentages first using the percentage calculator before averaging them here.
Test | Score | Out Of | Percentage |
Test 1 | 16 | 20 | 80% |
Test 2 | 40 | 50 | 80% |
How Do You Calculate Standard Deviation From an Average?
Standard deviation measures how spread out the numbers in a data set are from the average, and it is built directly on top of the same average this page produces. Two data sets can share an identical average while looking completely different once you look at how spread out the individual numbers are, which is exactly the extra context standard deviation adds. For the full calculation, the standard deviation calculator picks up where this page leaves off.
Data Set | Average | Spread |
18, 20, 22 | 20 | Tight |
5, 20, 35 | 20 | Wide |
FAQs
A few quick answers to the questions people most often ask about calculating an average.
What is the formula for average?
Average equals the sum of all the numbers divided by how many numbers there are. For 4, 8 and 12, that's 24 divided by 3, which gives an average of 8.
What is the difference between average and mean?
In everyday and mathematical use, average and mean refer to the same calculation. This calculator always uses the arithmetic mean definition when it produces a result.
Can the average be a decimal or a negative number?
Yes to both. Decimals show up whenever the sum doesn't divide evenly by the count, and negative averages happen when the data set includes negative numbers, such as temperatures or account balances.
How do you calculate a weighted average by hand?
Multiply each value by its weight, add those results together, then divide by the total of the weights rather than by the count of values.
Why is my average different from the median?
The average and median only match when a data set is evenly spread out. They diverge once a few unusually high or low numbers pull the average away from the typical value.